Regular readers of this blog will know that we’re big fans of using the Salesforce platform to do, well, almost everything. From internal communication, to coaching, to managing our user support process, we rely on our org to power as much of our business as we possibly can.
That said, we recognize that some of the system’s capabilities are nice-to-haves, while others are absolute essentials. And in terms of the latter, forecasting might just top the list. Day to day, our ability to accurately anticipate key sales and revenue figures enables us to make sound strategic decisions (which deals to prioritize, when to bring in a large hiring class, etc.). In the long term, that translates to sustainable growth.
If your organization is curious about how to effectively forecast using the Salesforce platform, this post is for you. It’ll help you understand the basics of sales and revenue forecasting, plus highlight what you need to start thinking about in order to build a winning strategy.
Step #1: Figure out what exactly you want to forecast — sales or revenue?
If you want your company to start forecasting using Salesforce, the first question you’ll need to answer is this: What exactly do you want to forecast? Sales, revenue, or both? The answer will depend on what you’re hoping to achieve.
Sales forecasting is a great way to monitor the expected performance of what you’re selling, who’s selling it, and the channels you’re selling through. Want to project sales by rep, product, service, industry, line of business, geography? However you want to do it, you can. As a result, leadership and reps will have the data they need to create the right plan of action every quarter. Is a particular territory expected to underperform? It might be time to bring on a new team member, then. Or maybe sales for a particular service are outpacing what the delivery team can realistically handle. If that’s the case, resources might need to be diverted from elsewhere.
Revenue forecasting, on the other hand, provides a more accurate way to measure the month-by-month health of your business. Let’s say one of your reps closes a $100K deal in February, for example. The entire amount of that deal was forecasted for February. Thing is, the company won’t see the entire amount in revenue up front, since payments are received as products ship. That means you’re looking at, say, $25K in March, $25K in April, $25K in May and $25K in June. That’s a very different picture than one painted solely by a sales forecast.
Deciding whether you want to forecast sales, revenue, or both comes down to your company’s unique needs. If you’re primarily concerned with sales performance, sales forecasting will likely be enough. If it’s important for you to have a detailed grasp on continuous cash flow, on the other hand — and for many companies, that’s certainly the case — you’ll probably want to forecast revenue, as well.
{{cta('082c66b0-c7e8-4a26-98ae-e7535c910537')}}
Step #2: Decide on a sales forecasting methodology.
For the moment, it doesn’t matter whether you want to tackle revenue forecasting or not, because the process always starts with sales forecasting. After all, you can’t get a grasp on cash flow until you have a good idea of the money the company is projected to bring in.
So how do you get started with sales forecasting, then? By deciding on a primary forecasting methodology.
One common option is based on probabilities. When a sales rep creates an opportunity, they’ll estimate the likelihood (represented by a percentage value) that they’ll win the deal. As the deal progresses, they can update that percentage accordingly, either increasing it or decreasing it. The Salesforce platform — or, more specifically, a dynamic report that lives inside the system — will then multiply the size of each deal by its corresponding probability and add the amounts. Let’s take a look at an example:
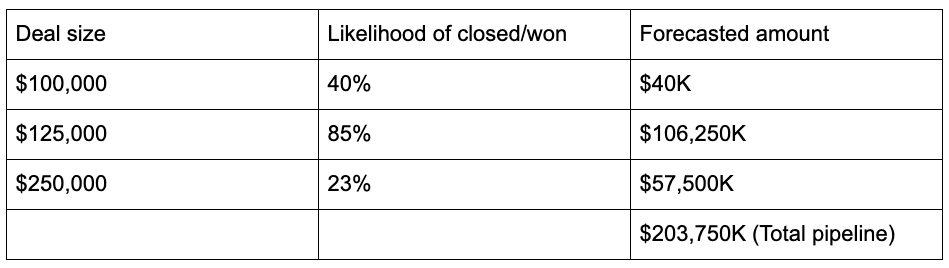
Many companies choose this methodology, and it’s by no means a bad option. However, it does present a problem: Forecasted amounts won’t actually represent a sum that’s possible based on the deals in play. As you can see here, there’s no way to add some combination of $100K, $125K and $250K to get $203K. With more opportunities in the pipe, the hope is that this issue becomes less pronounced, but it will still be there.
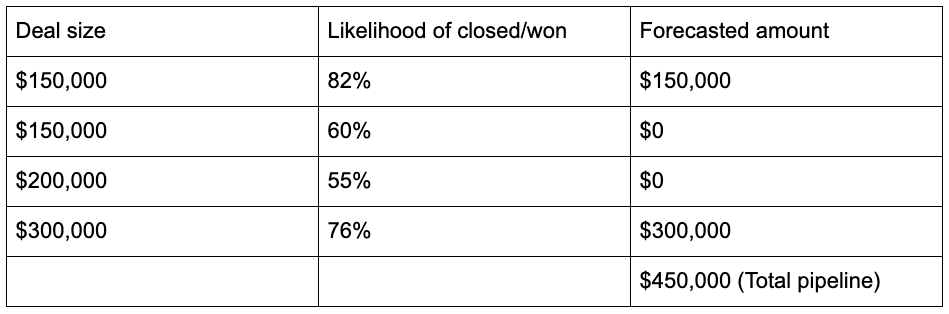
One fix we sometimes recommend is using a forecasting threshold. Instead of creating a report that multiplies each deal size by the likelihood it will convert, create one that pulls the total amount of each deal above a certain likelihood (say, 75%). That way, you’ll end up with a forecasted amount that’s actually possible. Here’s another example:
The other main way businesses tend to forecast sales is based on the idea of “confidence tiers.” Under this model, a deal begins its life as a basic opportunity. Once a rep has reason to believe that they’ve got a good shot at winning the deal, however, it can be marked as a “must win” — a higher priority category. Finally, once the customer has given a verbal yes, the deal can be marked as a “commit” — the last stage before “closed/won.” Sales leadership can then look at forecasted amounts based on category: What’s the total pipeline, how much of it is “must win,” how much of it is already committed. The “confidence tier” strategy offers a different way of looking at the numbers.
It has its problems, too, however — and a big one is the fact that it’s difficult to track how many committed deals each month actually convert to closed/won. Because if a commit needs to push back their timeline, the rep will simply update the date accordingly. So even though the deal might have been in the “commit” stage for February for several weeks, the win will show up in March’s numbers. As you can imagine, this can make forecasting somewhat less accurate.
So which method should you choose? The answer is… It depends. If you’re planning to move forward with revenue forecasting, you’ll want the most accurate forecast possible — which means you might want to go with our modified probability method. However, the “confidence tiers” method can also work, so long as you figure out a good way to track the movement of commitments and whether or not you actually win them. Ultimately, it’s up to you. There isn’t a “right” answer, as each method has it benefits and drawbacks. Your job is to assess which one you believe would better suit your business model.
Step #3: If you do want to forecast revenue, decide how you’ll do it.
Okay, that was sales forecasting. Now, on to revenue forecasting (which, if you’re not interested in, feel free to skip ahead to the next section).
To get started with revenue forecasting, you’ve got another choice to make (I know, this blog has basically become a choose-your-own-adventure story). Will you forecast using revenue schedules or trend analysis?
Revenue schedules are a Salesforce feature that determine when a product is paid for. In essence, they make it easy to report on accurate monthly revenue. Let’s return to our example from the first section of this post: Your rep closes a $100K deal in February, and the company will receive payments over the following four months. With revenue schedules, you’ll see $25K show up in the report for March, $25K in the report for April and so on. In this way, you can move beyond pure sales projections and see when the money would actually hit the bank, so to speak.
Trend analysis, meanwhile, is exactly what it sounds like: The use of historical data to make predictions about the future. Which, thanks to Salesforce tools like Einstein Analytics, you don’t have to calculate manually. Instead, you can see automatically generated revenue projections based on information from previous months or years.
Which way is better? You guessed it: It depends. If your numbers tend to be pretty consistent year over year, it probably makes sense to choose the trend analysis method. If your orders are wildly different month to month and year to year, it would be better to go with revenue schedules.
Step #4: Build an awesome dashboard.
Up to this point, I’ve mentioned reports a number of different times — which means you’ve probably gathered that they’re the backbone of sales and revenue forecasting in Salesforce. They automatically pull the data you’re looking for, run any necessary calculations, and display the results in whatever way you choose.
However, you’re unlikely to get all the forecasting data you want from a single report. As we mentioned at the start of this post, you might want to forecast by rep, product, industry, line of business, territory — that’s multiple reports right there. In order to conveniently view all of your forecasting data in one place, you’ll want to build a custom dashboard.
As Salesforce itself puts it, “dashboards allow you to present multiple reports side-by-side using dashboard components on a single dashboard page layout.” You can think of them as central data hubs that allow you to compare key forecasting metrics at a glance. For many sales teams, their forecasting dashboard becomes their single source of truth.
All right, there you have it: A 10,000-foot view of sales and revenue forecasting in Salesforce. Hopefully it provides enough food for thought to get you started. If you have questions about where to go next, don’t hesitate to reach out. We’d be happy to help you figure out the ideal next steps for your company.
